© Benaki Phytopathological Institute
Prototype Spatio-temporal Predictive System for codling moth
7
Table 2.
Temperature data, based on meteorological, LST and regression data averaged
across the data of seven model weather stations.
Date
(Julian)
Average temperatures calcu-
lated according to weather
stations data (T
meteo
), (°C)
Average temperatures calcu-
lated according to MODIS LST
data (raw LST data), (°C)
Average temperatures cal-
culated by using regression
models (LST
meteo
), (°C)
2017_073-80
-2.25
-0.85
-1.98
2017_081-88
5.57
6.49
5.49
2017_089-96
4.37
6.94
4.84
2017_097-104
9.83
11.82
8.79
2017_105-112
14.45
16.16
13.55
2017_113-120
14.30
19.77
16.00
2017_121-128
14.96
18.39
14.59
2017_129-136
21.80
24.73
21.84
2017_137-144
18.70
22.56
19.05
2017_145-152
20.43
23.94
19.93
2017_153-160
20.74
25.27
20.80
2017_161-168
24.12
27.58
23.99
2017_169-176
26.37
29.15
26.12
2017_177-184
23.94
27.71
24.81
2017_185-192
27.88
30.91
27.48
RMSE
3.24*
0.66**
* Root Mean Square Error (RMSE) of average temperatures calculated according to weather stations data and
average temperatures calculated according to MODIS LST data comparison.
** Root Mean Square Error (RMSE) of average temperatures calculated according to weather stations data and
average temperatures calculated by using regression models comparison.
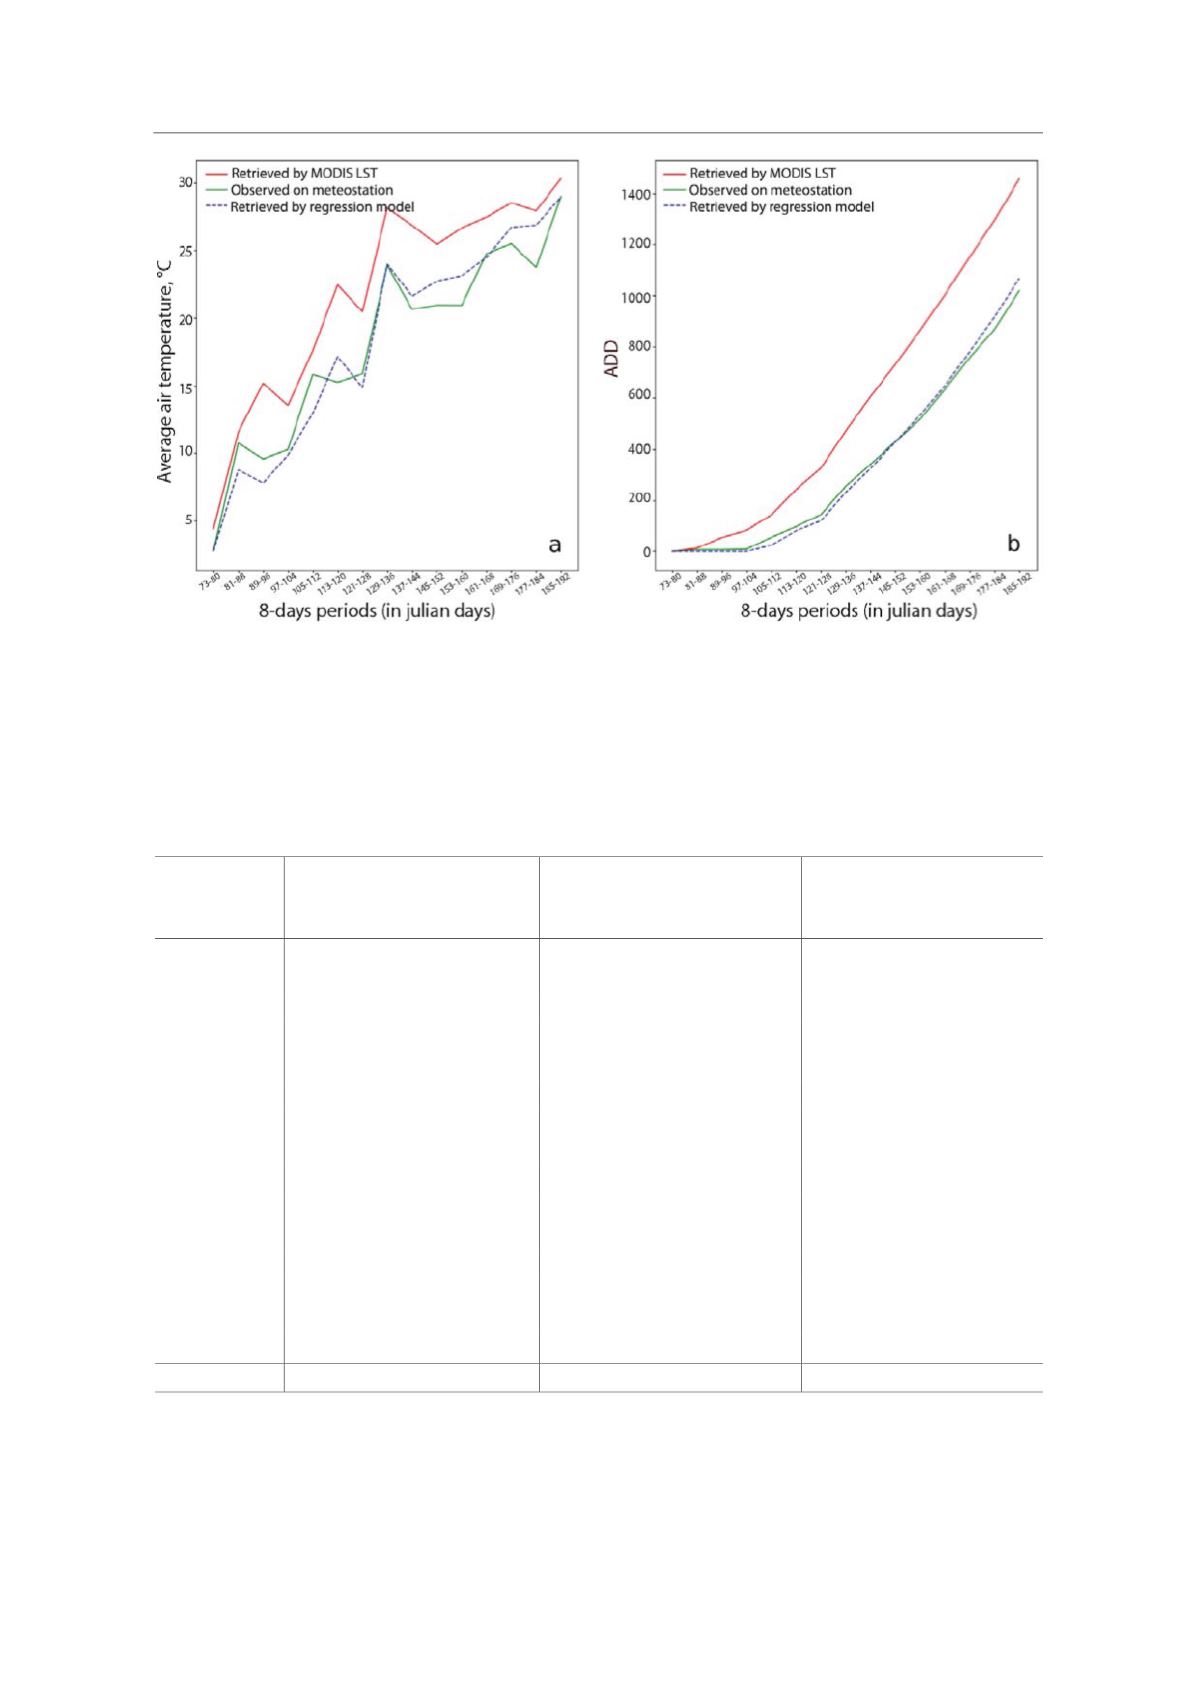
Figure 4.
The dynamics of the average temperatures (a) and the ADD (b) calculated from the meteorological data (T
meteo
),
raw LST data and by using regressiom formula (LST
meteo
) for meteorological station Zharkent (368590).


