© Benaki Phytopathological Institute
Afonin
et al.
6
* LST
day
+ 0.982 * LST
night
. Figure 4a shows a
comparison between the mean 8-day tem-
peratures on the meteorological data (T
me-
teo
), raw LST data and values calculated by
the regression formula (LST
meteo
). The aver-
age 8-day temperatures were recalculated
into ADD with a threshold value of 10°C (Fig-
ure 4b).
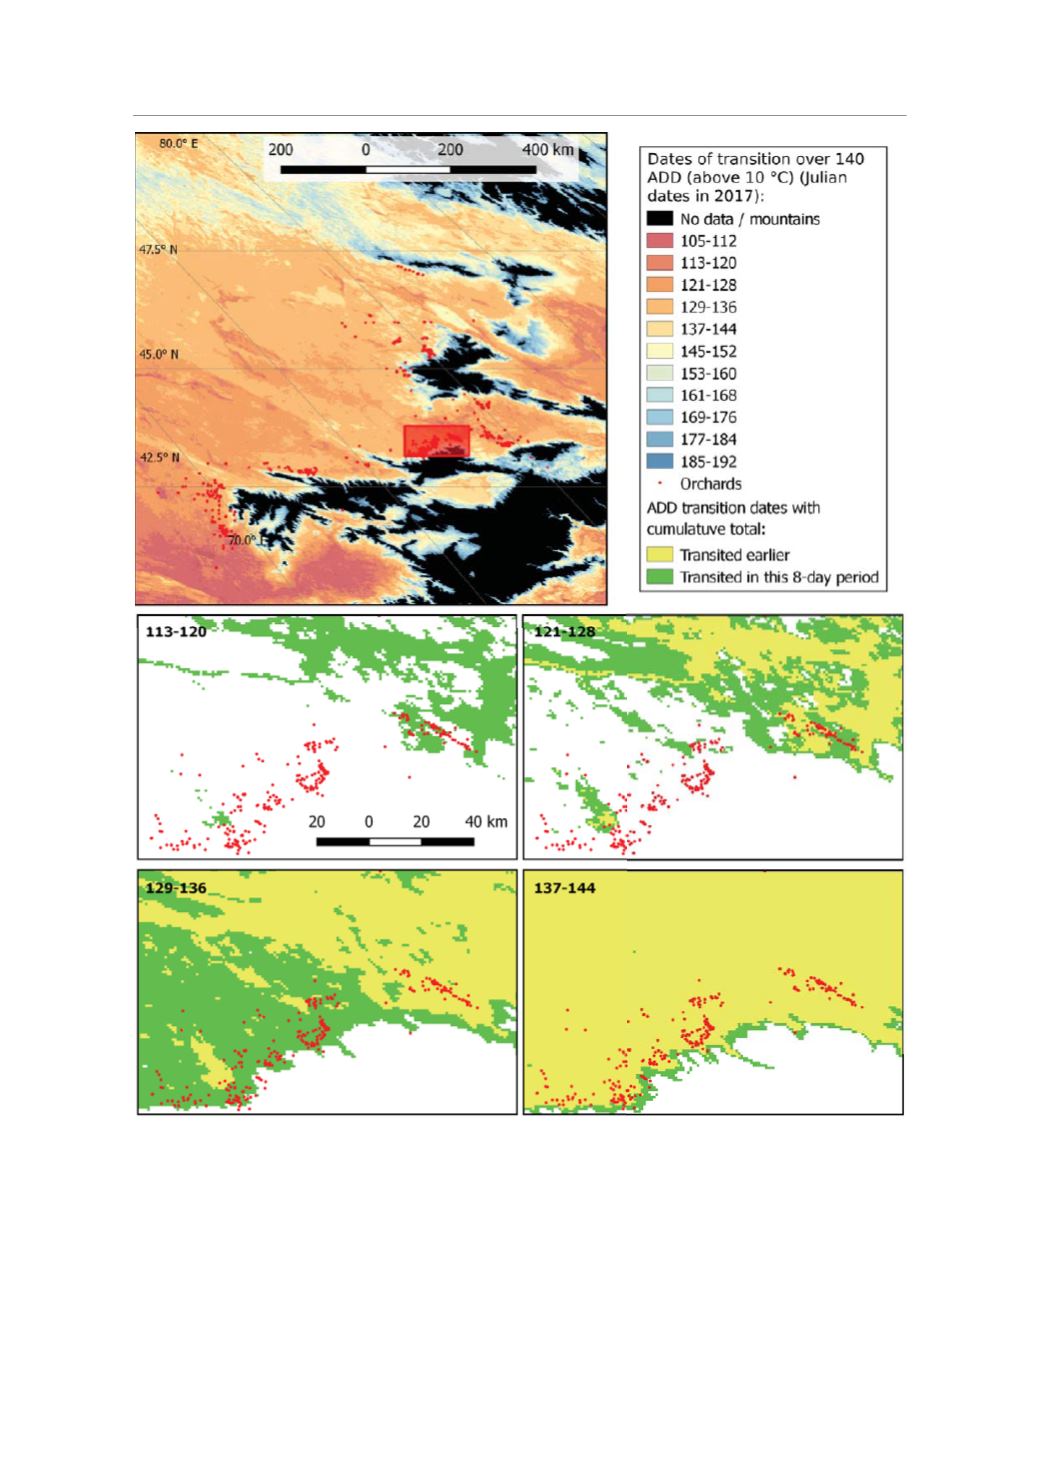
Figure 3.
Dates of transition over 140 ADD (above 10
o
C) (Julian dates in 2017) in Southeastern Kazakhstan and the variant
of presentation of codling moth first fligh 8-day prediction. Red dots show the apple orchards location.


